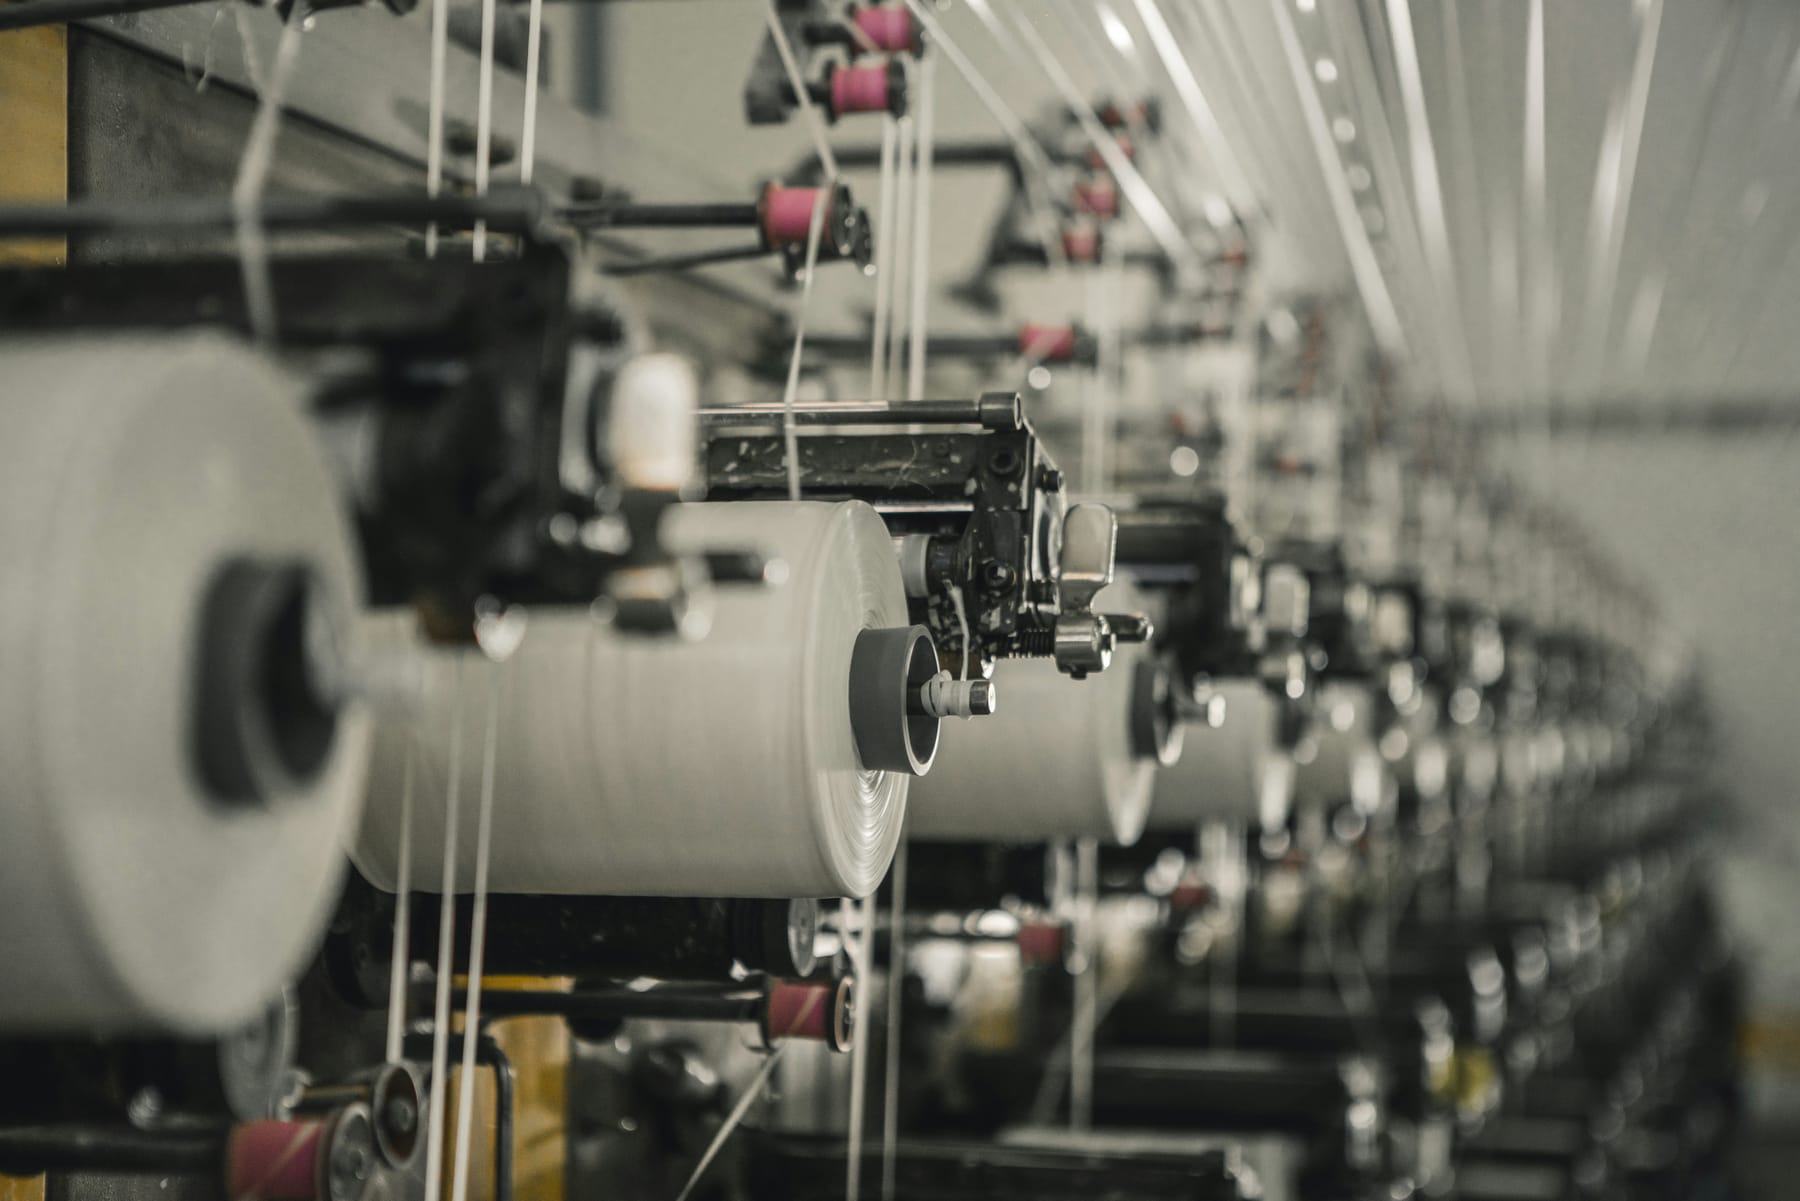
Ask people where the carbon in a T-shirt comes from and many will point to the journey: the container ship from the other side of the world, the lorry to the shop. It is an intuitive answer, and it is worth looking beyond.
Production and transport contributions vary with the product, energy sources, route and transport mode. The examples below show why the full lifecycle matters.
Where the studies find the carbon
Each of these studies measures something different, so their numbers sit side by side rather than adding up.
Across the fashion industry. When Global Fashion Agenda and McKinsey mapped the fashion industry’s emissions, around 70% came from upstream activities: producing materials, preparing them and processing them.
Across the apparel industry, by stage. The Measuring Fashion study by Quantis and the ClimateWorks Foundation split the apparel industry’s total greenhouse gas emissions by stage. Three stages made up more than half of that total:
- dyeing and finishing — 36%
- yarn preparation — 28%
- fibre production — 15%
One product, across its life. A study that followed cotton shirts made in China through their whole lives found that cotton farming and industrial processing — spinning, weaving, dyeing and sewing — accounted for more than 90% of each shirt’s footprint.
Why the dye bath matters so much
Dyeing and finishing is where fabric gets its colour, its softness and its resistance to shrinking. Much of that work happens in water, and much of that water has to be hot. Heating it, drying the fabric afterwards and running the machines all take energy — and in a textile mill, energy is where the carbon is.
The same cotton-shirt study named energy consumption, and electricity above all, as the main contributor to a textile product’s footprint. That is why how and where a garment is made can matter as much as what it is made from.
So what does the ship add?
In the case of sea freight, often less than people expect. The UK government’s 2025 conversion factors put an average container ship at around 16 grams of CO₂e for every tonne of cargo it carries one kilometre.
Illustrative example: sea freight. A 200-gram T-shirt shipped 15 000 km by container ship. The weight, route and factor are assumptions for the example.
| The voyage | |
|---|---|
| Weight | 0,0002 tonnes |
| Distance | 15 000 km |
| Emission factor, container ship | about 16 g CO₂e per tonne-km |
| Carbon added by the voyage | just under 50 g CO₂e |
For scale: the cotton shirts in the life-cycle study came to about 8,8 kg CO₂e each over their whole lives. That study’s shirts are not this example’s T-shirt, but against a footprint of that size, a voyage like this one would be well under 1%.
Where the journey can matter: air freight
Air freight is a different case. The same government factors put long-haul air freight at about 530 grams of CO₂e per tonne-kilometre — more than thirty times a container ship — or about 900 grams if the extra warming effect of emissions released at altitude is included.
Illustrative example: air freight. The same 200-gram T-shirt flown 8 000 km picks up about 0,85 kg of CO₂e, or about 1,4 kg with the effect at altitude included.
Close to a kilogram or more is no longer a rounding error. In a case like this, the transport mode becomes a real part of the footprint, and it comes from a choice about speed rather than anything about the shirt itself.
What the examples suggest
- Two shirts that look identical can carry different footprints, and in the studies above most of the difference arises in making the fibre and fabric.
- Distance is only one factor. The transport mode matters too: in these examples, a sea voyage added little, while air freight added much more.
- Many of the questions that matter are ones a label rarely answers: what the fibre is, how it was dyed and finished, and what powered the factory.
Better product intelligence can help make meaningful improvements across production and supply chains visible in everyday decisions.